Client profile
Extra Colors is a modern paint company specializing in high-quality paints, wall coatings, and façade systems. With a strong focus on innovation, quality, and continuous improvement, the company has built a broad portfolio of products serving professionals, builders, and homeowners.
The Problem: Manual Production Tracking
The factory produces dozens of bagged products, with hundreds of units moving through the line every day. Previously, production quantities were recorded manually, making it difficult to keep an accurate and up-to-date view of production and inventory.
With many different products being manufactured, even small counting errors could affect inventory records. A product might appear to be sufficiently stocked when the actual quantity is lower than expected, or additional production could be scheduled unnecessarily. These discrepancies can make production planning more difficult and may contribute to delays in fulfilling customer orders.
The challenge was to create a reliable way to track production quantities automatically and make those records useful for stock review, production planning, and understanding the performance of each line.
The Solution: A Shared Production Platform
We developed a production monitoring platform with camera-based product recognition at its core. Automatic detection and counting provide the production data used across its dashboard, stock records, targets, and reports.
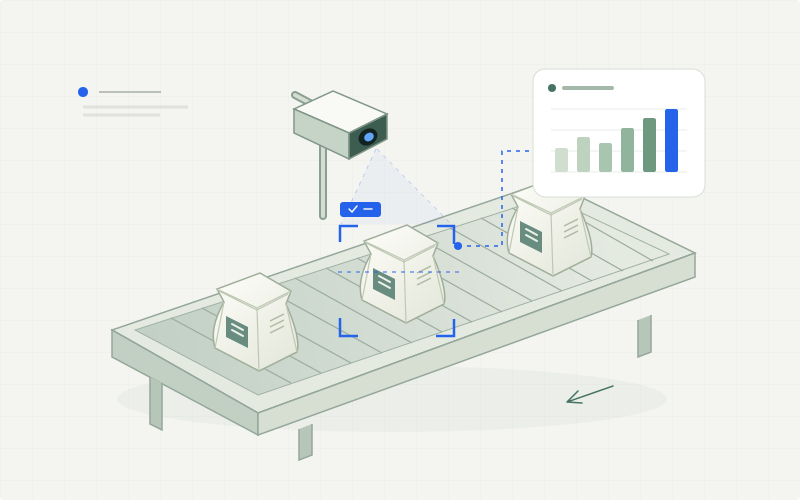
An industrial camera was installed above the production line, and a computer vision model was trained to recognize the different products being produced. As each bag passes through the camera's field of view, the system identifies the product and updates the production count in real time.
The platform brings these automatic records together with manual entries and sales records. Managers can follow live activity, review stock, set production goals, and investigate past events using the same production history.
A dashboard for production and stock
Live status across production lines
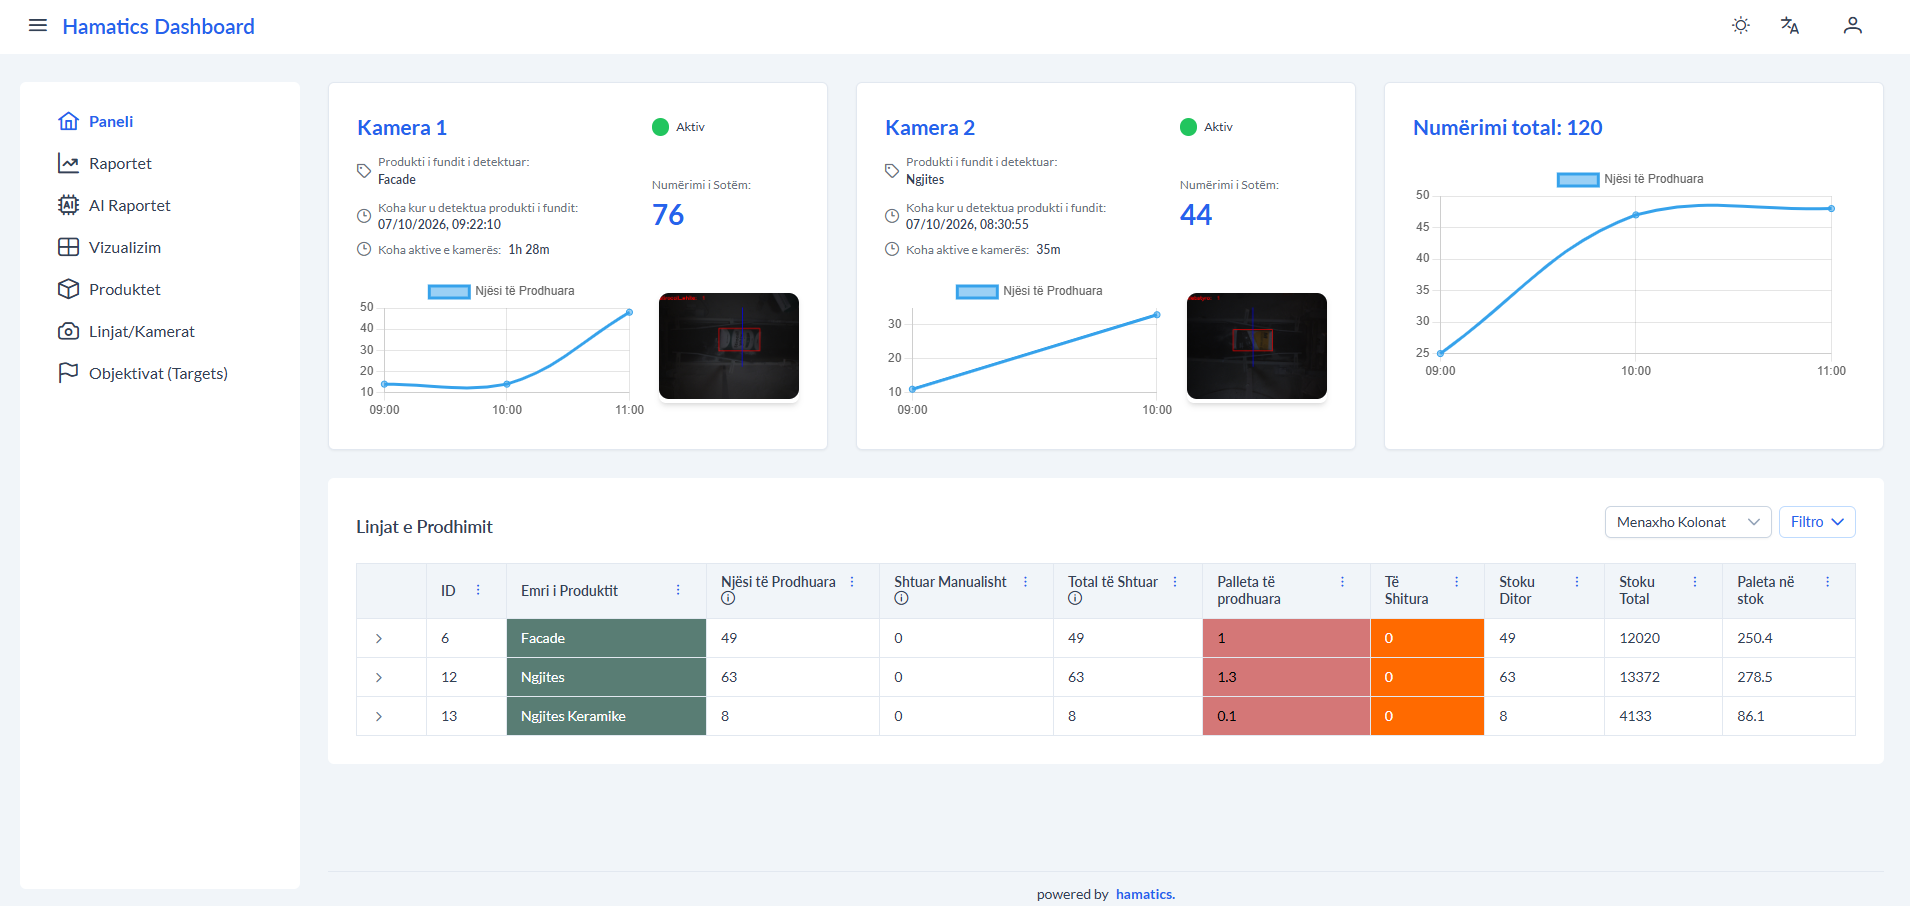
The dashboard shows whether each camera is active or offline, which product it detected most recently, and when that detection occurred. Daily production totals and charts help the team follow activity across the monitored lines and spot changes in output. A product table brings production, sales, and stock figures into the same overview.
Product and stock management
For each product, the platform brings together automatically counted production, quantities added manually, sales, and the current stock balance. This lets the team review stock levels alongside production activity and sales when deciding what to produce next. Users can choose which columns to display so the table focuses on the figures relevant to their work.
Production targets with progress tracking
The team can set a target by selecting a product, a camera or production line, a time interval, and the quantity to produce. The system tracks progress automatically as products are detected and sends a notification when the target is reached.
Following progress against a defined quantity and deadline helps managers organize production around orders and see which goals are complete or still need attention.
Reports that explain production activity
Product reports over a selected period
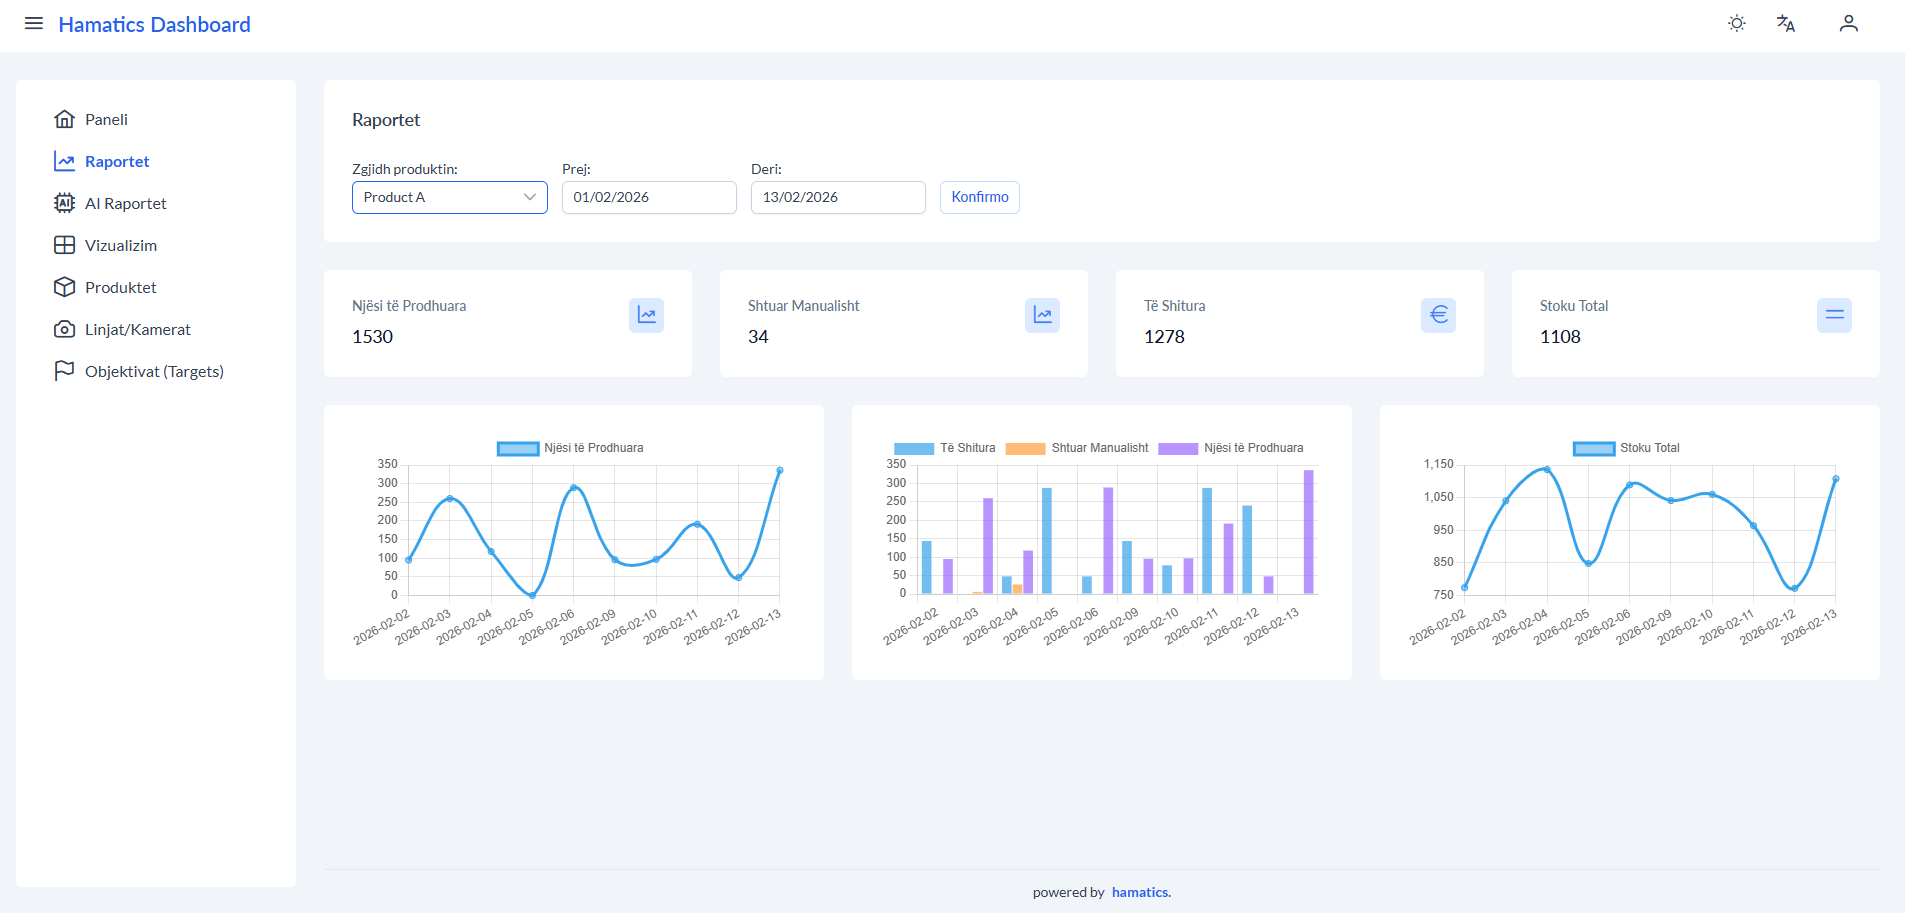
By choosing a product and date range, users can review how much was produced, added manually, and sold, together with the stock balance. Charts show production and sales trends over time, making it easier to compare periods and investigate differences between output and demand.
Line and camera performance
A separate view lets users select a camera and time interval to review the line's active time, average daily operating time, and total units produced. Production charts and a breakdown by product show how output changes over time. These records help the team compare lines and investigate periods of low activity or potential bottlenecks.
AI-generated monthly reports
Selecting a month generates a report with a monthly summary, weekly breakdowns, and analysis for each product. The AI highlights patterns and potential issues in the recorded data, such as low stock, overproduction, or imbalances between production and sales. These summaries give managers another way to review the figures and identify areas that need attention when planning production and supply.
A visual record of product detections
Each product detection is recorded with its timestamp, source camera, and a screenshot. Users can filter this history by product and time interval to find a specific event and review the visual evidence behind the count.
This gives the team a way to check individual records and investigate discrepancies, with a traceable history of what the cameras detected on the production line.
See the system in action
Watch a real example of the AI-powered production monitoring system in use on a live production line.
The Results: Better Visibility, Better Production Planning
The team can now follow production from individual camera detections through to product totals, stock balances, and progress against targets. Live camera status and visual records make the production figures easier to check and investigate.
Product reports and line analysis make historical activity available for planning, while monthly AI reports highlight patterns for review. Managers can use these views to understand how production, sales, and stock relate over time and decide where to focus the next production run.
The practical outcome is a shared operational record for monitoring output, managing stock, checking targets, and reviewing line performance.
The practical difference
Camera-based counting supports stock management, production goals, visual verification, and informed planning.